
See which staff members, promoters, widgets, and partner channels drive the most reservations, admissions, and revenue.
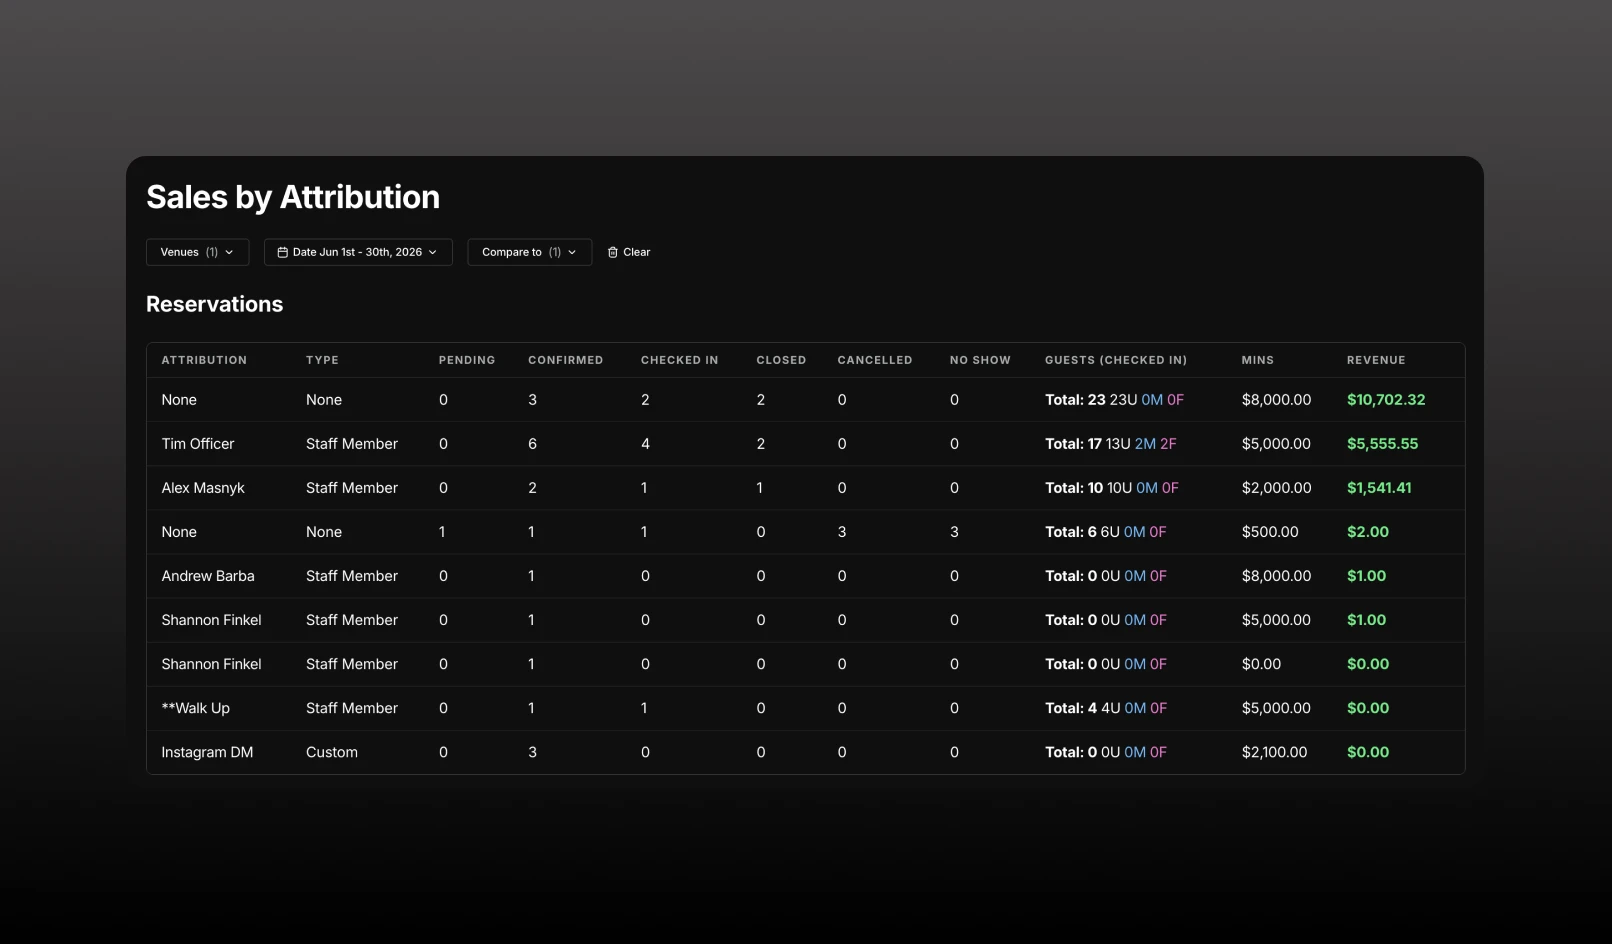
See which staff members, promoters, widgets, and partner channels drive the most reservations, admissions, and revenue.
Open the sidebar, expand Analytics, then click Attribution.
What's new
Reservations
The Reservations table shows booking and lead performance for each attribution source, including:
Only sources with reservation activity during the selected period are displayed.
Admissions
The Admissions table measures performance for tickets, guest lists, and tally, including:
Only sources with admission activity during the selected period are displayed.
Custom attribution sources
Need to track performance from partners or marketing channels? Create custom attribution sources for channels like Instagram campaigns, hotel concierges, influencers, or local partners.
Once bookings are attributed to those sources, they'll automatically appear in Sales by Attribution reporting alongside staff, promoters, and system-generated sources.
Why it matters
Sales by Attribution helps you understand where bookings are coming from, identify your highest-performing promoters and channels, and make better decisions about staffing, partnerships, and marketing spend.