
< All updates
September 14, 2026

New Analytics (on Dashboard): Performance by day / series

Analytics Dashboard now breaks down performance by weekday or recurring series.
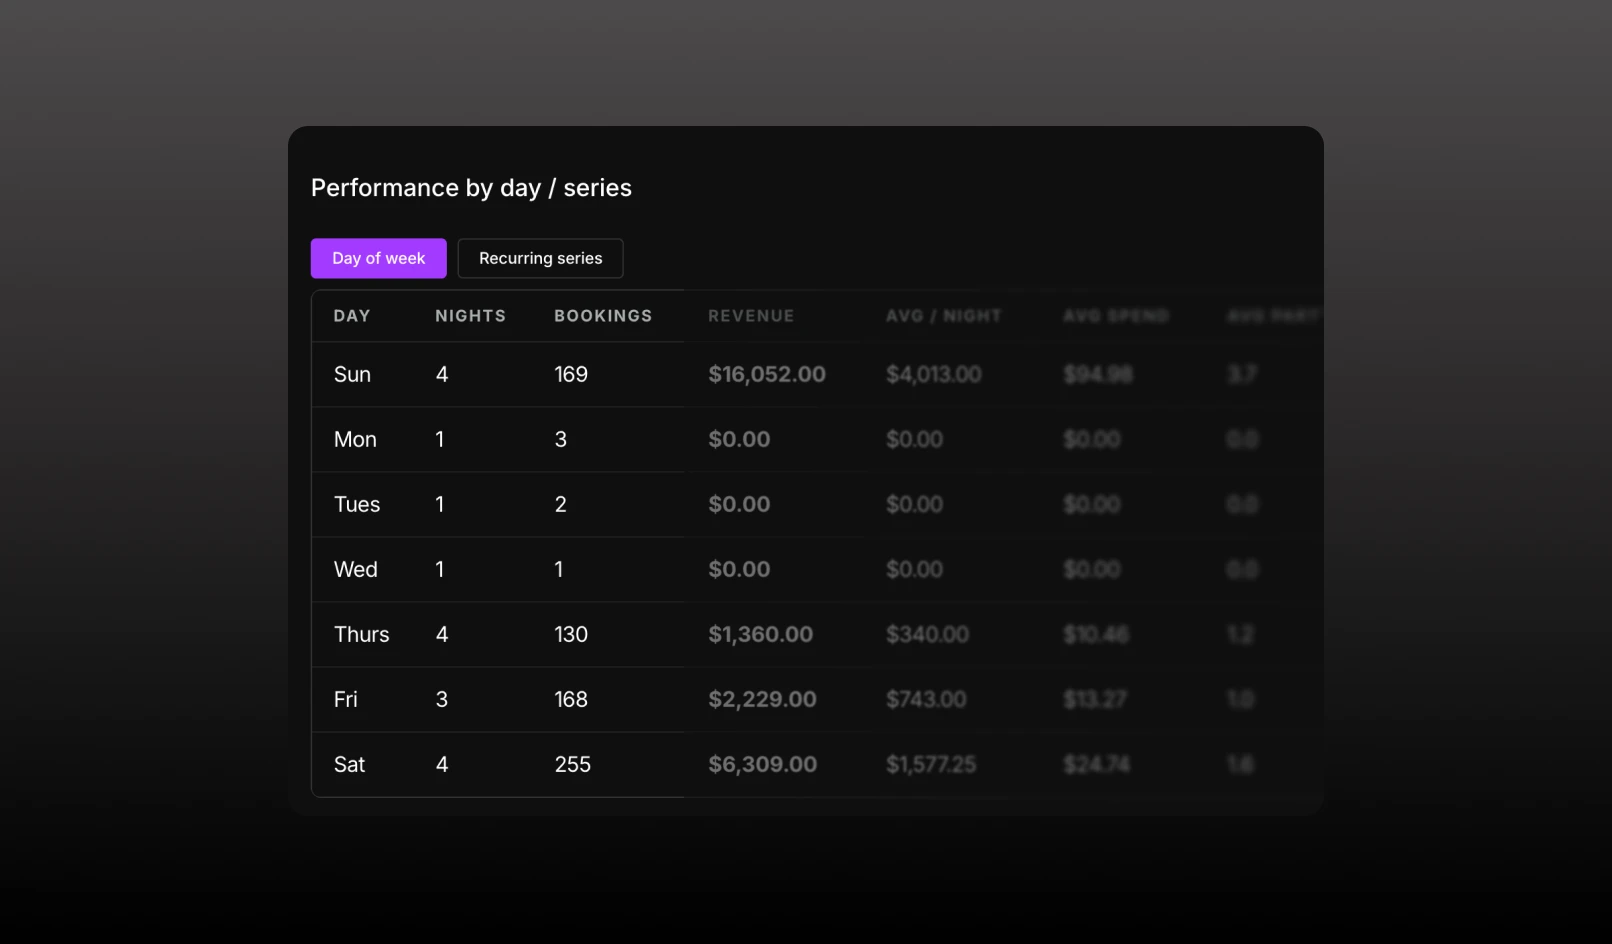
Analytics Dashboard now includes Performance by day / series, under Guest counts by date.

Toggle between:

  • Day of week: Sun–Sat in calendar order
  • Recurring series: each recurring event series, highest revenue first

Both views use the same venue and date filters as the rest of Dashboard.

  • Day / Series: Weekday, or the recurring event name
  • Nights: Distinct diary nights in that bucket (e.g. 4 Fridays in a month, not 1)
  • Bookings: Admission groups in the selected range
  • Revenue: Total spent
  • Avg / night: Revenue ÷ nights
  • Avg spend: Revenue ÷ bookings
  • Avg party: Expected guests ÷ bookings
  • Cancel %: Cancelled reservations ÷ reservation total
  • Deny %: Denied leads ÷ lead total
  • Checked-in %: Checked-in ÷ expected reservations

Day of week uses the nightlife diary date, so a Friday night stays Friday even for west-coast venues.

Recurring series groups by the event’s recurring identifier. One-off events are left out of this tab (they still count in Day of week).